Packed Bed Reactor
Introduction
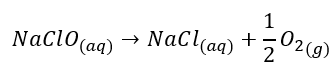
Packed bed reactors can simply be described as a PFR with a fixed bed of catalyst suspended in the reactor. Our feed enters the reactor and passes through the bed of catalyst, accelerating the rate of reaction. In this experiment, we will be observing the break down of sodium hypochlorite (NaClO) – which is broken down to oxygen and sodium chloride:
The sodium hypochlorite is made by dissolving chlorine into a solution of sodium hydroxide (11 < pH < 13). Nickel is used as the catalyst for this system. It is in fact Nickel superoxide that is the catalyst for this reaction, but we simply just need to add nickel as our catalyst. The surface of the nickel is exposed to the air, allowing for surface oxidation to occur all over the nickel catalyst; thus, making nickel oxide. The hypochlorite solution further oxidizes the nickel oxide to make nickel superoxide. Nickel (IV) superoxide is extremely unstable so it quickly breaks down to form nickel oxide again.
Although the theory for this experiment seems very simple, and it really is, this lab is very taxing experimentally. Many iterations of tests will need to be taken. Creating a system to which certain lab members can take samples, while other are preparing for testing and another team actually performing the analytical test. I will spend most of this discussion explaining the different theoretical concepts behind the each step in the process, without delving in too much into the experimental procedure itself. I recommend reading the lab manual and test procedure to follow along with this discussion and fill in any gaps you may have learning the content.
Iodemetric Analysis
To determine the extent of bleach degradation, we plan on measuring the the “available chlorine” and the mass concentration of sodium hypohlorite present in the feed and compare it to the product stream after running the feed through the PBR. Following the procedure outlined in the DS2022 – 89 file, you can see it explain how to create a standard solution of sodium thiosulfate and starch. These two solutions will be used together to measure the amount of available chlorine present in solution.
So what is happening when we mix our reagents and standards together that allows us to determine the concentration of NaOCl in solution? First, we outline the reactions that are taking place:
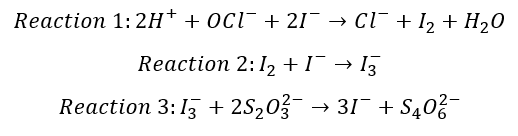
The first reaction indicates that under acidic conditions (presence of H+ ions) , iodide ions will react with hypochlorite ions to produce iodine and chloride ions. Now you may all know that iodine is only slightly soluble in water, but we need it to completely dissolve into solution so that we can continue our analysis. This is why we add a slight excess of iodide solution (potassium iodide) to our reacting mixture to dissolve the iodine produced from reaction 1 into solution. Reaction 2 shows how we get the iodine to dissolve into solution. Reacting iodine with excess iodide will produce a triodide complex, which is completely soluble in water.
Taking the product stream coming our of the PBR, and adding the necessary reagents to meet reactions 1 and 2, we are ready to run our titration. The titre here is the standard sodium thiosulfate solution we measured/made in the lab. We can see the end-point for this titration when the reddish-yellow colour of the reacting mixture disappears. This colour arises because of the dissolve iodide ions in solution. The colour disappears as the iodine solution (triiodide ions) are converted by the thiosulfate ions to iodide ion in solution (which is colourless).
Although iodine solution is self-indicating, the colour can be very faint, especially at the concentrations we will be working with in the lab. It might be very difficult to tell that we reached the end point. To avoid errors, we can add starch solution. In the presence of iodine in solution, starch solution goes blue-black. The end-point of this titration is reached when the solution goes from blue-black to colourless. You must make sure to not add the starch solution too early! When these two reagents are mixed together, iodine and starch form a blue-black complex. If you add it too early, the complex will be very stable. In other words, titrating with thiosulfate will not be able to break down the complex and thus the thiosulfate won’t be able to react with the iodine (triiodide ions).
As you can see, with all the information we have available – known concentrations of standards, titre volume, etc. – we can back-calculate the “available chlorine” and hypochlorite solution. Following ASTM D2022 – 89, equations have been developed using our process of creating our standard solutions.
Preparation of Standard Solutions
You will notice that in this experiment, we are not directly measuring the thiosulfate or hypochlorite change in moles/concentration. This is because we can’t use sodium thiosulfate as a primary standard of an indicator. Primary standards of indicators have the following characteristics:
-
At least 99.9% pure
-
Stable compound (doesn’t regularly decompose under most conditions)
-
Preferably high in weight (to lower weight errors)
Instead, if you remember fro the ASTM document, you are told to standardize our thiosulfate solution with with potassium iodate (KIO3) – which is a primary standard. The ionic equation between thiosulfate and iodate ions is shown below:
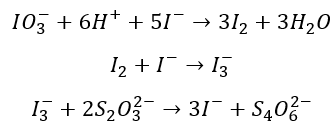
To standardize our thiosulfate solution, you can see that you simply wold just have to run the titration explained in the previous section. Using the ionic equation, you can calculate the number of moles of iodine in solution and use that to find the thiosulfate concentration.
Following the ASTM document, you can use the equations in the document to perform your analytical analysis.
PFR/PBR Analysis
Our discussion up to now was to understand how our analytical procedure allows us to determine the concentration of the hypochlorite coming in and out of the reactors. Now, lets look at the PFR design equation:
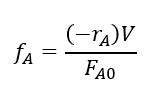
You can quickly point out that this design equation is for a PFR, not a PBR. The design for PBRs can be very complicate, with a multitude of different considerations need to be taken into account. However, if you realize the only inherent difference in each PBR is the volume of catalyst in the reactor. The overall volume of each reactor will be the same and the design equation (assuming same temperature and inlet flow rate), the only difference in the outlet conversion will be due to the difference in catalyst volume.
You can look at the effect of other factors if you run the experiment with two reactors of the same catalyst volume. For example, if you’d like to examine the effect of temperature on a PBR.
Factors that can affect the final conversion coming out of the PBR:
-
Volume of catalyst
-
Volume of reactor
-
Temperature
-
Inlet flow rate of reactant